10 U.S. States With Most COVID Cases Per 100,000 People in Past 7 Days
Several states in the Midwest of the country, including North and South Dakota, have reported the highest number of infections per capita in the last week.
Coronavirus cases in the U.S. have soared past 7.8 million, with nearly 216,000 reported deaths, as of Wednesday, according to Johns Hopkins University.
Here we look at 10 states with the highest number of infections reported per capita (100,000 people) in the last seven days, according to the latest report Tuesday by the U.S. Centers for Disease Control and Prevention (CDC).
Case data below is sourced from the CDC, unless otherwise stated. All population data below is from the U.S. Census Bureau, as of July 2019.
1. North Dakota
Cases per 100,000 in last 7 days: 72.9
Total cases: 28,245
Total population: 762,062
Average daily new cases in North Dakota increased from late June through October, peaking at 572 on October 12. The average count flattened out from March through late June, according to data compiled by Johns Hopkins University (JHU).
2. South Dakota
Cases per 100,000 in last 7 days: 70.1
Total cases: 28,925
Total population: 884,659
Average daily new cases in South Dakota flattened out from mid-July to mid-September, before rising sharply through October. The average count peaked at 611 on October 9, according to JHU.
Read more
New Coronavirus Deaths Are Increasing in These 16 States
Half of the 20 Metro Areas Worst-Hit by COVID Are All in One State
What We Must Learn from the COVID-19 Response
Calif. Religious School Asks Over 1,600 to Quarantine After COVID Outbreak
New York Sweet 16 Party Deemed COVID Superspreader, Linked to 37 Cases
Oklahoma City Runs out of ICU Beds as COVID Cases Spike
3. Montana
Cases per 100,000 in last 7 days: 51.5
Total cases: 19,125
Total population: 1,068,778
The average daily case tally in Montana flattened out from mid-July to mid-September. The figure rose sharply through October, peaking at 611 on October 9, according to JHU.
4. Wisconsin
Cases per 100,000 in last 7 days: 45.9
Total cases: 160,331
Total population: 5,822,434
Average daily new cases in Wisconsin increased for most of the outbreak, apart from from mid-July to early September when the average count flattened out, according to JHU.
5. Utah
Cases per 100,000 in last 7 days: 36.7
Total cases: 86,832
Total population: 3,205,958
The average daily case tally in Utah increased from March to mid-July, before dropping through mid-August and flattening through early September. The figure then rose sharply through October, peaking at 1,229 on October 11, according to JHU.
6. Idaho
Cases per 100,000 in last 7 days: 34.5
Total cases: 48,663
Total population: 1,787,065
Average daily new cases in Idaho increased from early September, after declining from late July. The daily case count flattened out from March to early June, before rising sharply through late July, according to JHU.
7. Nebraska
Cases per 100,000 in last 7 days: 33.9
Total cases: 52,839
Total population: 1,934,408
Average daily new infections in Nebraska rose on a sharp incline from early September, after flattening out for months from May, according to JHU.
8. Iowa
Cases per 100,000 in last 7 days: 32.6
Total cases: 100,194
Total population: 3,155,070
Average daily new cases in Iowa increased from early August, peaking at 1,177 on August 29, after flattening out from late April, according to JHU.
9. Oklahoma
Cases per 100,000 in last 7 days: 29.9
Total cases: 106,484
Total population: 3,956,971
Average daily new infections in Oklahoma rose sharply from early June to late July, before dropping through late August. From then, the average count rose sharply through October, peaking at 1,234 on October 8, according to JHU.
10. Tennessee
Cases per 100,000 in last 7 days: 29.5
Total cases: 217,682
Total population: 6,829,174
The average daily case tally in Tennessee rose sharply from late May through late July, when it peaked at 2,484 on July 29. The figure declined through late September, before rising again through October, according to JHU.
People in the Broadway neighborhood of Nashville, Tennessee, pictured on August 7. The state is among the 10 states that have reported the most COVID-19 cases per capita in the last seven days, according... People in the Broadway neighborhood of Nashville, Tennessee, pictured on August 7. The state is among the 10 states that have reported the most COVID-19 cases per capita in the last seven days, according to the U.S. Centers for Disease Control and Prevention. Jason Kempin/Getty Images
The wider picture
The novel coronavirus has infected more than 38.2 million people across the globe since it was first reported in Wuhan, China, including over 7.8 million in the U.S. Globally, more than a million have died following infection, while more than 26.5 million have reportedly recovered as of Wednesday, according to JHU.
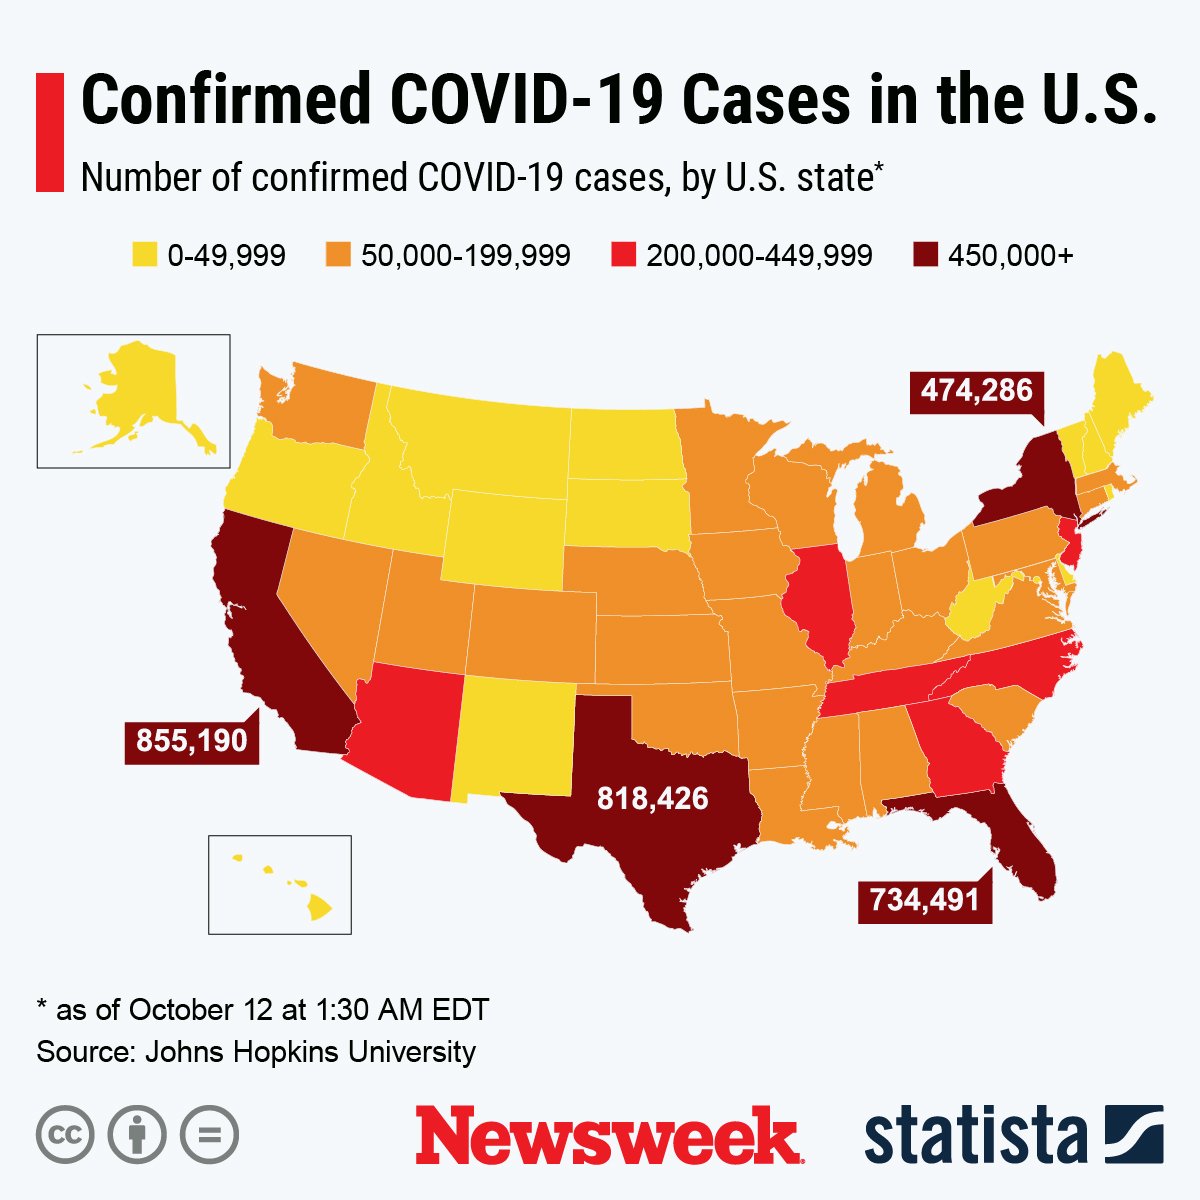
The graphic below, provided by Statista, illustrates the spread of COVID-19 across U.S. states.
StatistaThe graphic below, also produced by Statista, illustrates a survey of U.S. adults concerned about catching COVID-19.