Coronavirus cases in the U.S. have surpassed 6.8 million, with over 200,000 deaths, according to the latest figures from Johns Hopkins University (JHU). But at least a handful of states have each reported a decline in new cases per capita (100,000 people) in the latest two-week period.
Below are five states that have reported the largest decrease in new cases per capita over the past week, from the previous seven days, according to data compiled by The New York Times. All population data below from the U.S. Census Bureau, as of July 2019.
South Carolina
Week-to-week change in new cases per capita: 1,468
New cases per capita in week one: 5,444
New cases per capita in week two: 6,912
Total population: 5,148,714
Total confirmed cases: 138,124
Average daily new cases in South Carolina remained mostly flat from early April to early June before rising on a sharp incline through early July, peaking at 1,986 on July 11. The average daily case count mostly declined through September 9. It rose sharply through September 12, before dropping again, according to the latest report Tuesday by JHU.
Read more
20,000 American Flags Placed at Washington Monument to Honor COVID Victims
Five States Where Coronavirus Cases Are Rising Fastest
U.S. Coronavirus Death Toll Passes 200,000
Trump Says U.S. Doing 'Better Than Europe' on Coronavirus—It's Not
Louisiana
Week-to-week change in new cases per capita: 1,007
New cases per capita in week one: 3,619
New cases per capita in week two: 4,626
Total population: 4,648,794
Total confirmed cases: 162,501
Average daily new cases in Louisiana rose sharply from mid-March to early April before dropping sharply through late April. From then, the average daily case count mostly flattened out through late June. It mostly increased through early August, peaking at 2,727 on August 3, and mostly dropped throughout September, according to the latest report Tuesday by JHU.
Michigan
Week-to-week change in new cases per capita: 386
New cases per capita in week one: 5,379
New cases per capita in week two: 5,765
Total population: 9,986,857
Total confirmed cases: 129,655
Average daily new cases rose sharply from mid-March to early April, peaking at 1,757 on April 2. The average daily case count mostly declined through early June before mostly rising through mid-August, after which it mostly flattened out through September, according to the latest report Tuesday by JHU.
Hawaii
Week-to-week change in new cases per capita: 276
New cases per capita in week one: 703
New cases per capita in week two: 979
Total population: 1,415,872
Total confirmed cases: 11,590
Average daily new cases in Hawaii remained mostly flat from late March to late July, before rising sharply through mid-August. The average daily case count slightly flattened out through early September before dropping sharply again through the rest of September, according to the latest report Tuesday by JHU.
Delaware
Week-to-week change in new cases per capita: 76
New cases per capita in week one: 730
New cases per capita in week two: 806
Total population: 973,764
Total confirmed cases: 19,667
The average daily case count in Delaware rose sharply from mid-March to April 27, when it peaked at 333. It then mostly declined through early June before mostly flattening out through early August. Average daily new cases rose sharply through mid-August before dipping through early September, according to the latest report Tuesday by JHU.
People on the beach in Myrtle Beach, South Carolina on September 5. South Carolina reported a decline in new COVID-19 cases in recent weeks. People on the beach in Myrtle Beach, South Carolina on September 5. South Carolina reported a decline in new COVID-19 cases in recent weeks. Sean Rayford/Getty Images
The wider picture
The novel coronavirus has infected over 31.3 million people across the globe since it was first reported in Wuhan, China. Over 965,800 have died following infection, while more than 21.5 million have reportedly recovered, as of Tuesday, according to JHU.
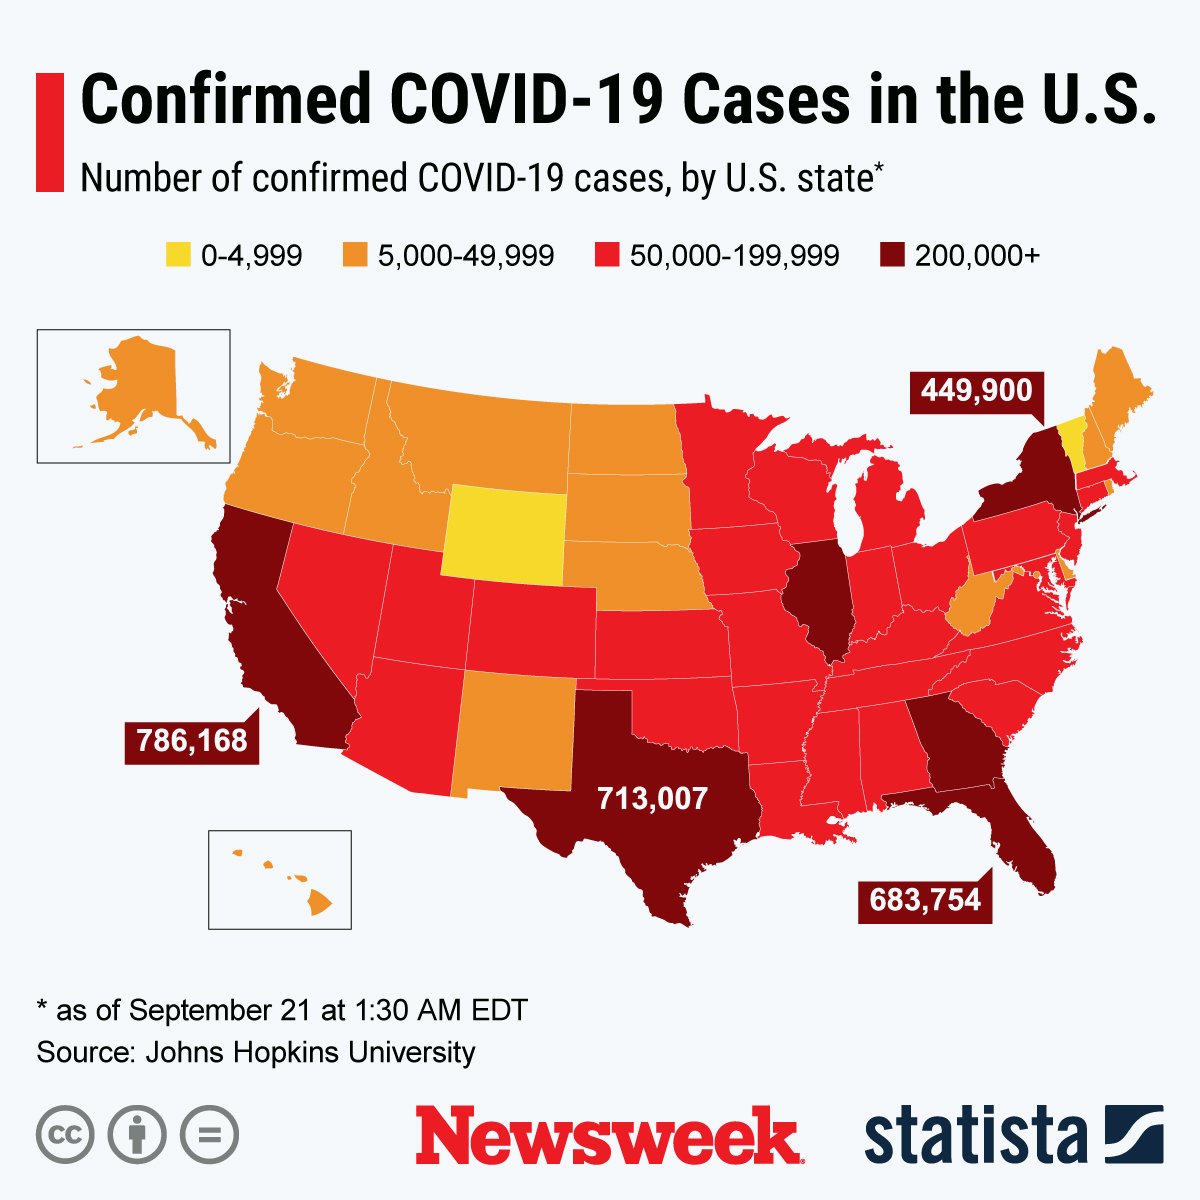
The graphic below, provided by Statista, illustrates U.S. states with the most COVID-19 cases.
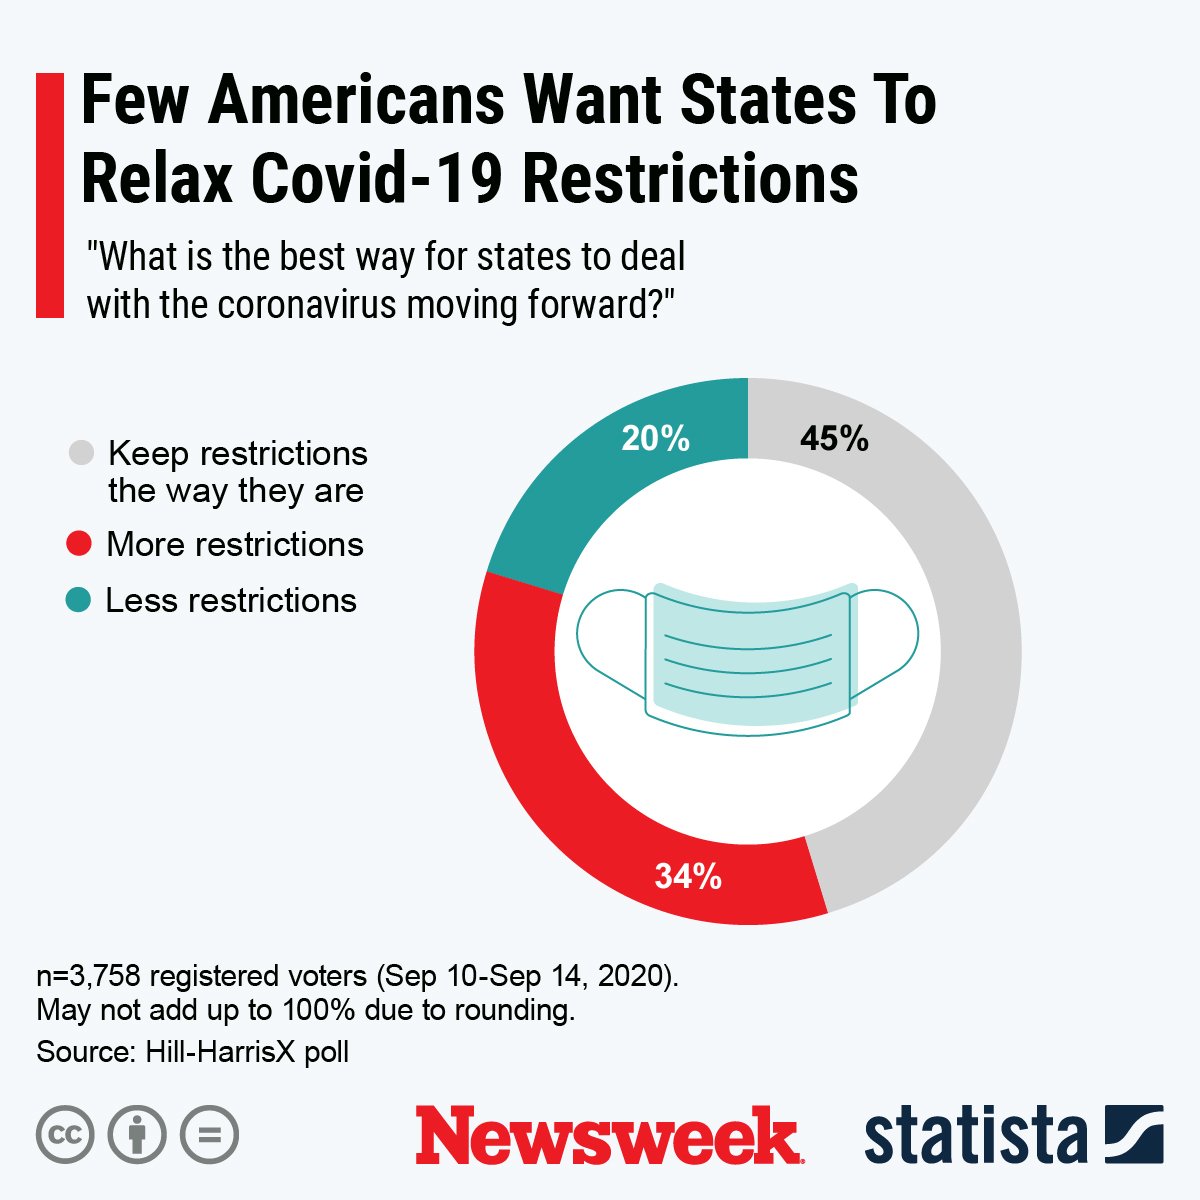
STATISTAThe below graphic, also provided by Statista, illustrates the percentage of Americans who do or don't want COVID-19 restrictions to be relaxed in the country.
STATISTAThe graphics below, also provided by Statista, illustrate the spread of COVID-19 cases in counties across the globe.