Novel coronavirus cases in the U.S. have soared past 4.7 million, according to the latest report Wednesday by Johns Hopkins University.
Here we take a closer look at nine states that have reported a rise in average daily case counts over a 14-day period from July 21 to August 3, according to data compiled by Johns Hopkins University.
Daily case counts below reflect a three-day moving average of daily new cases reported from July 21 to August 3.
Alaska
Day 1 (July 21): 85.33
Day 14 (August 3): 86
Highest daily case count in 14-day period: 134 on August 1
Lowest daily case count in 14-day period: 69 on July 23
The average daily case count in Alaska mostly increased in the latest 14-day period, apart from a couple of dips reported from July 21-22 and July 27-29. On August 1, the state reported its highest three-day rolling average since the outbreak began.
Average daily new cases mostly declined from late March until mid-May. The average daily case count mostly increased through July 20.
Maine
Day 1 (July 21): 11.67 new cases
Day 14 (August 3): 13.33 new cases
Highest daily case count in 14-day period: 25.67 on July 25
Lowest daily case count in 14-day period: 8.67 on July 22
While Maine reported a statistical increase in the latest 14-day window, its average daily case counts have declined from their highest points in May, when the state reported surges of over 48 cases per day, with a peak of 69 on May 21.
Read more
Private Sector Jobs Growth Six Times Worse Than Expected in July
Trump Says COVID Cases 'Coming Down Very Rapidly' in Three States
Study: Nationwide Mask Mandate in April Could Have Saved 40K American Lives
Coronavirus Test Tracking Suggests 19 Million Americans Possibly Infected
Massachusetts
Day 1 (July 21): 262
Day 14 (August 3): 387.67
Highest daily case count in 14-day period: 467.67 on July 30
Lowest daily case count in 14-day period: 262 on July 21
The average daily case tally in Massachusetts mostly increased over the recent two-week period, with a spike from July 27-30, reaching its peak of the 14-day period on July 30.
However, the average daily case count has been mostly declining from April 24, when it peaked at 3,507, before mostly flattening out from around June 15 to July 7.
South Dakota
Day 1 (July 21): 57
Day 14 (August 3): 70.67
Highest daily case count in 14-day period: 90.67 on July 30
Lowest daily case count in 14-day period: 57 on July 21
While the average daily case count in South Dakota mostly increased in the recent 14-day period, it has overall been decreasing since May 8, when it reached its peak with 204 average daily new cases. The figure mostly flattened out from around June 3 to July 17.
Rhode Island
Day 1 (July 21): 89.67
Day 14 (August 3): 122.67
Highest daily case count in 14-day period: 192 on July 28
Lowest daily case count in 14-day period: 24 on August 1
Average daily new infections in Rhode Island saw some dramatic spikes in the latest 14-day period, including from July 25-28 and August 1-3.
However, the average daily case count has been mostly declining from April 24, when it peaked at 429, after which it continued to mostly increase, with a few dips in between.
Virginia
Day 1 (July 21): 987.67
Day 14 (August 3): 1,150
Highest daily case count in 14-day period: 1,236 on July 26
Lowest daily case count in 14-day period: 936 on July 31
While Virginia has seen a few spikes in the latest 14-day period, including on July 26 and August 3, the average daily case counts in this period were still lower than the peak level reached on May 26, when it hit 1,335.
Average daily new cases mostly decreased from May 26 before starting to rise on a sharper incline from July 7, according to the data from Johns Hopkins University.
A waiter at The Inn at Little Washington, a restaurant in the town of Washington in Virginia, talking to customers on May 29, 2020. A waiter at The Inn at Little Washington, a restaurant in the town of Washington in Virginia, talking to customers on May 29, 2020. Getty Images
Maryland
Day 1 (July 21): 680.33
Day 14 (August 3): 829.67
Highest daily case count in 14-day period: 1,036.67 on July 26
Lowest daily case count in 14-day period: 680.33 on July 21
Average daily new cases in Maryland mostly increased in the recent 14-day period, rising on a sharp incline from July 21-26 as well as from July 29 to August 1.
However, spikes were lower than the record average daily new case count of 1,256 reported on May 20. Since then, average daily new cases mostly declined until around late June when they began to increase again.
Michigan
Day 1 (July 21): 620.67
Day 14 (August 3): 614.33
Highest daily case count in 14-day period: 872 on July 30
Lowest daily case count in 14-day period: 600 on August 2
Average daily new cases in Michigan have been mostly rising in the recent 14-day period. But the highest count reported in the two-week window was much lower than the peak reached on April 2, when it hit 1,757. Since then, the average daily case count mostly dipped until June 9, after which it increased on a sharper incline.
Hawaii
Day 1 (July 21): 18
Day 14 (August 3): 131
Highest daily case count in 14-day period: 131 on August 3
Lowest daily case count in 14-day period: 18 on July 21
While Hawaii reported a surge in new cases in the recent 14-day period, its average daily case count has been declining since April 3. The average daily case count hovered at around one or two new cases from late April to early June before rising again.
The graphics below, provided by Statista, illustrate the spread of COVID-19 cases in the U.S.
1 of 2
STATISTA
STATISTASTATISTA
More than 18.5 million people globally have been infected since the virus was first reported in Wuhan, China. Over 11.1 million globally have reportedly recovered from infection, while over 701,600 have died, as of Wednesday, according to the latest figures from Johns Hopkins University.
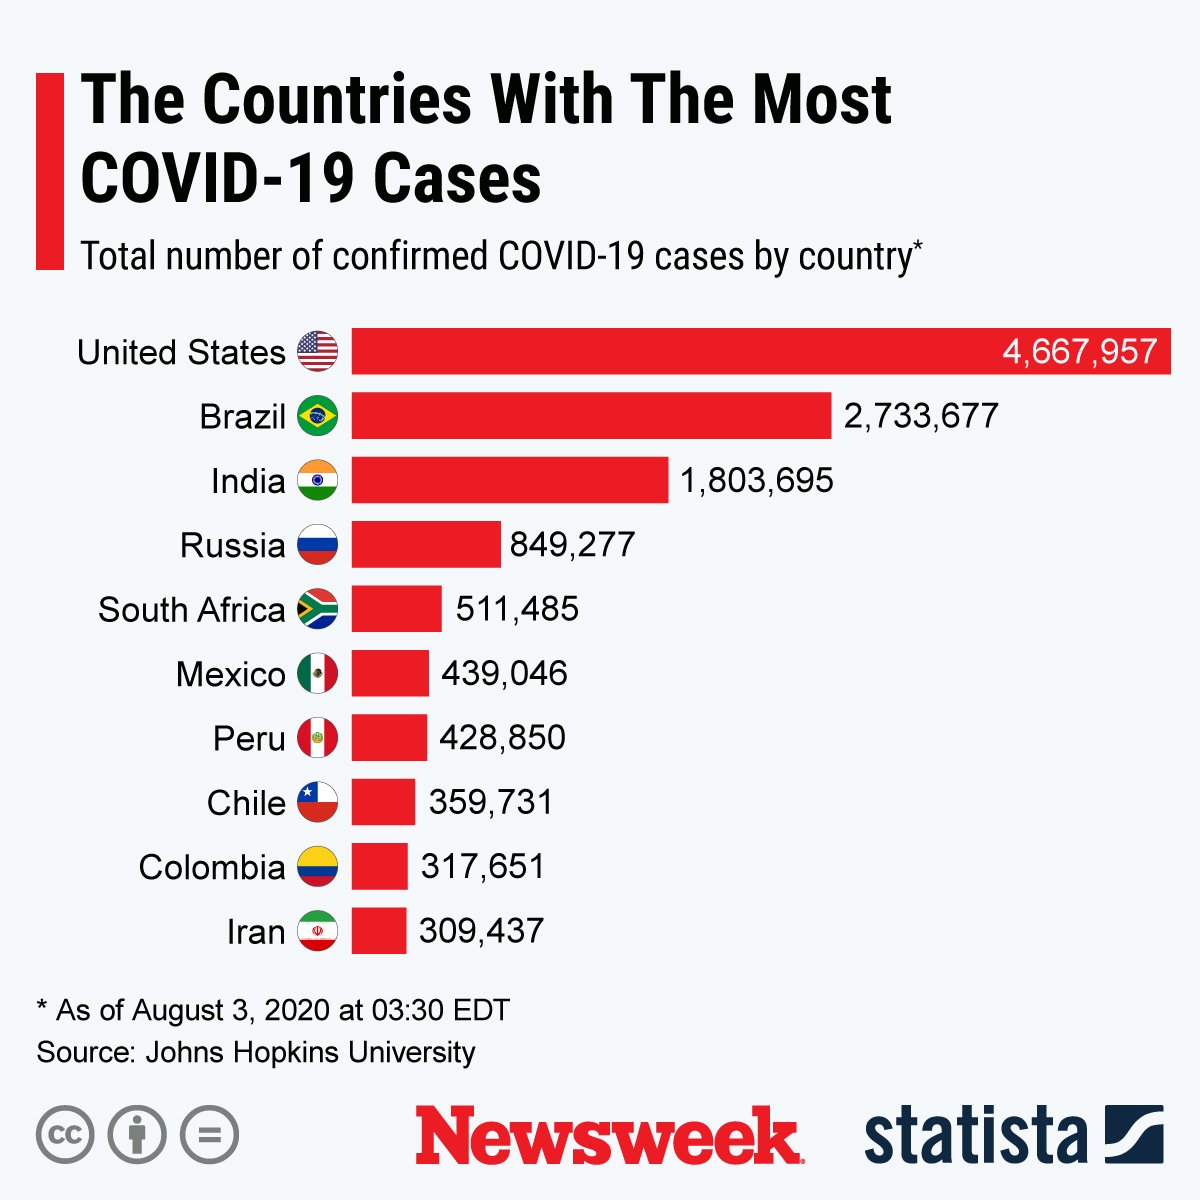
The graphic below, provided by Statista, illustrates countries with the most COVID-19 cases.
STATISTACorrection 8/5/20, 1 p.m. ET: This article's methodology was corrected to accurately reflect the data.